Adding Service Checks for Monitoring
ObserveOps (formerly known as AIOps) monitors service availability by running checks against specific protocols, ports, and endpoints. Create a discovery profile, run it, then provision the discovered services as monitors. Once provisioned, ObserveOps continuously checks availability and generates alerts when services go down. You can customize Monitor Settings for each monitor, including polling intervals, thresholds, and alert notifications.
Service Checks Supported
| Service Check |
|---|
| Ping |
| Port |
| URL |
| RADIUS |
| REST API |
| NTP |
| Domain |
| DNS |
| FTP |
| SSL Certificate |
- Ping
- Port
- URL
- RADIUS
- REST API
- NTP
- Domain
- DNS
- FTP
- SSL
Adding Ping for Monitoring
1. Create a Discovery Profile
Go to Menu. Select Settings  . Select Discovery Settings
  . Select Discovery Profile. The Discovery Profile screen opens. Select Create Discovery Profile.
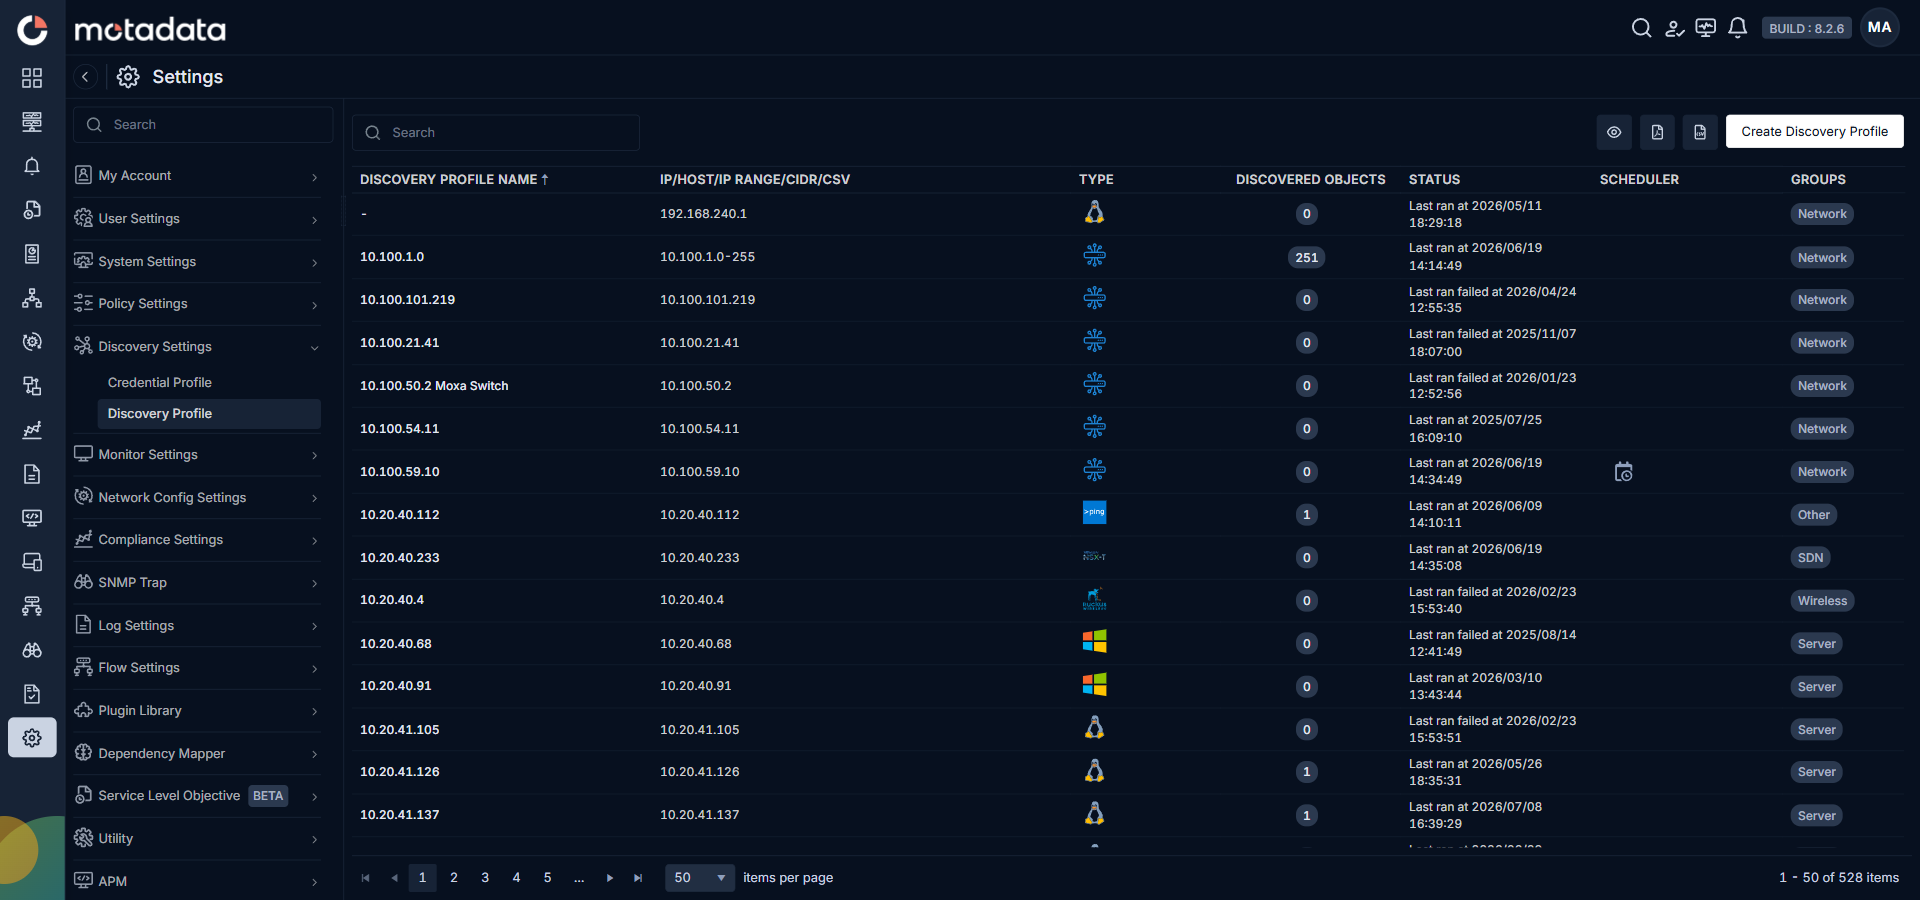
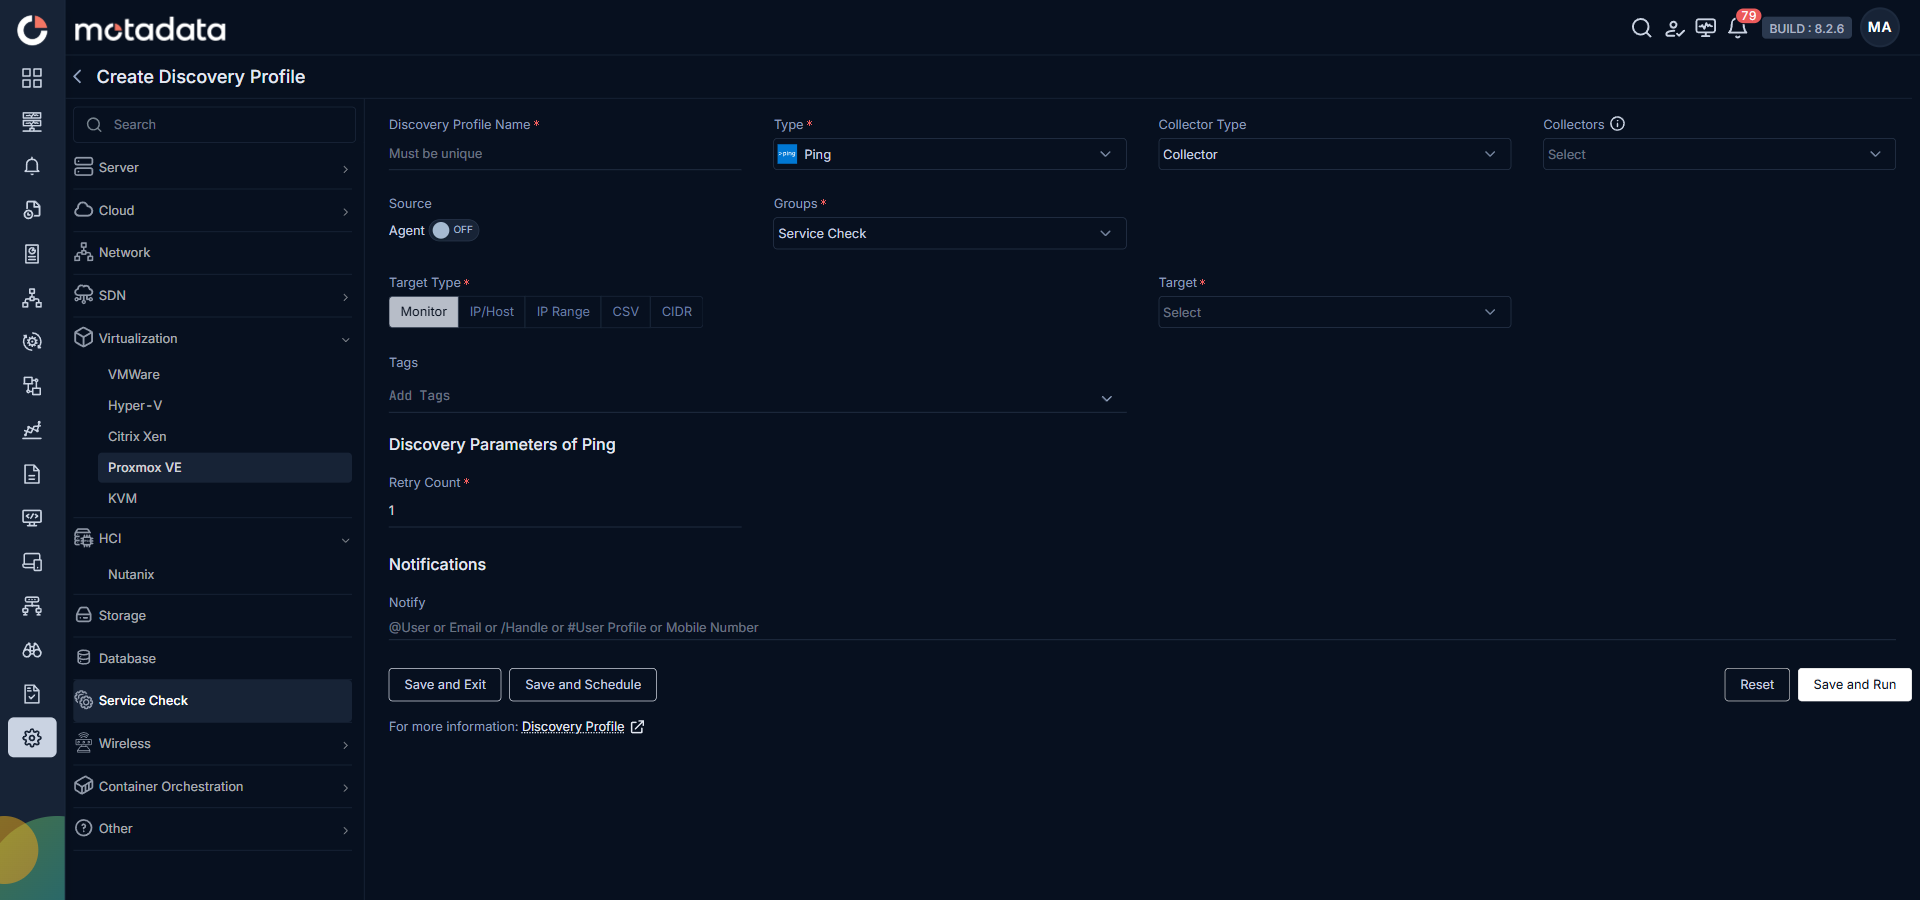
The Create Discovery Profile form opens. Select Service Check from the sidebar.
| Field | What to Enter |
|---|---|
| Discovery Profile Name | A unique name to identify this profile |
| Type | Select Ping |
| Collectors | One or more Collectors for data collection. If you skip this, ObserveOps selects a Collector automatically. |
| Agent | Toggle on to route monitoring through a MotaAgent. |
| Agents | The agent to use. Only appears when the Agent toggle is on. |
| Groups | One or more Groups to assign to provisioned monitors |
| Target Type | The address format for the ping target: - Monitor: A monitor already in ObserveOps. - IP: A single IP address. - IP Range: A continuous range of IP addresses. - CIDR: A subnet in CIDR notation. - CSV: A CSV file containing IP addresses. |
| Target | The specific monitor, IP, range, CIDR, or CSV file to ping |
| Tags | Tags to assign to discovered monitors |
| Retry Count | Number of retries before ObserveOps considers the service unavailable |
| Notify Team | Email addresses, handles, or user profiles to notify when discovery completes |
Select Collectors based on how you want to distribute the monitoring load.
Select Save and Run to save and start discovery immediately. Select Save and Schedule to schedule the run for a specific time. Select Save and Exit to save without running.
2. Provision the Discovered Devices as Monitors
After the discovery run completes, ObserveOps shows all discovered devices.

Select the devices you want to add as Monitors. Select Add Selected Objects to provision them. ObserveOps now checks availability continuously.
To view the monitors, go to Menu. Select Monitor. Select Service Check.
Adding Port for Monitoring
1. Create a Discovery Profile
Go to Menu. Select Settings . Select Discovery Settings . Select Discovery Profile. The Discovery Profile screen opens. Select Create Discovery Profile.
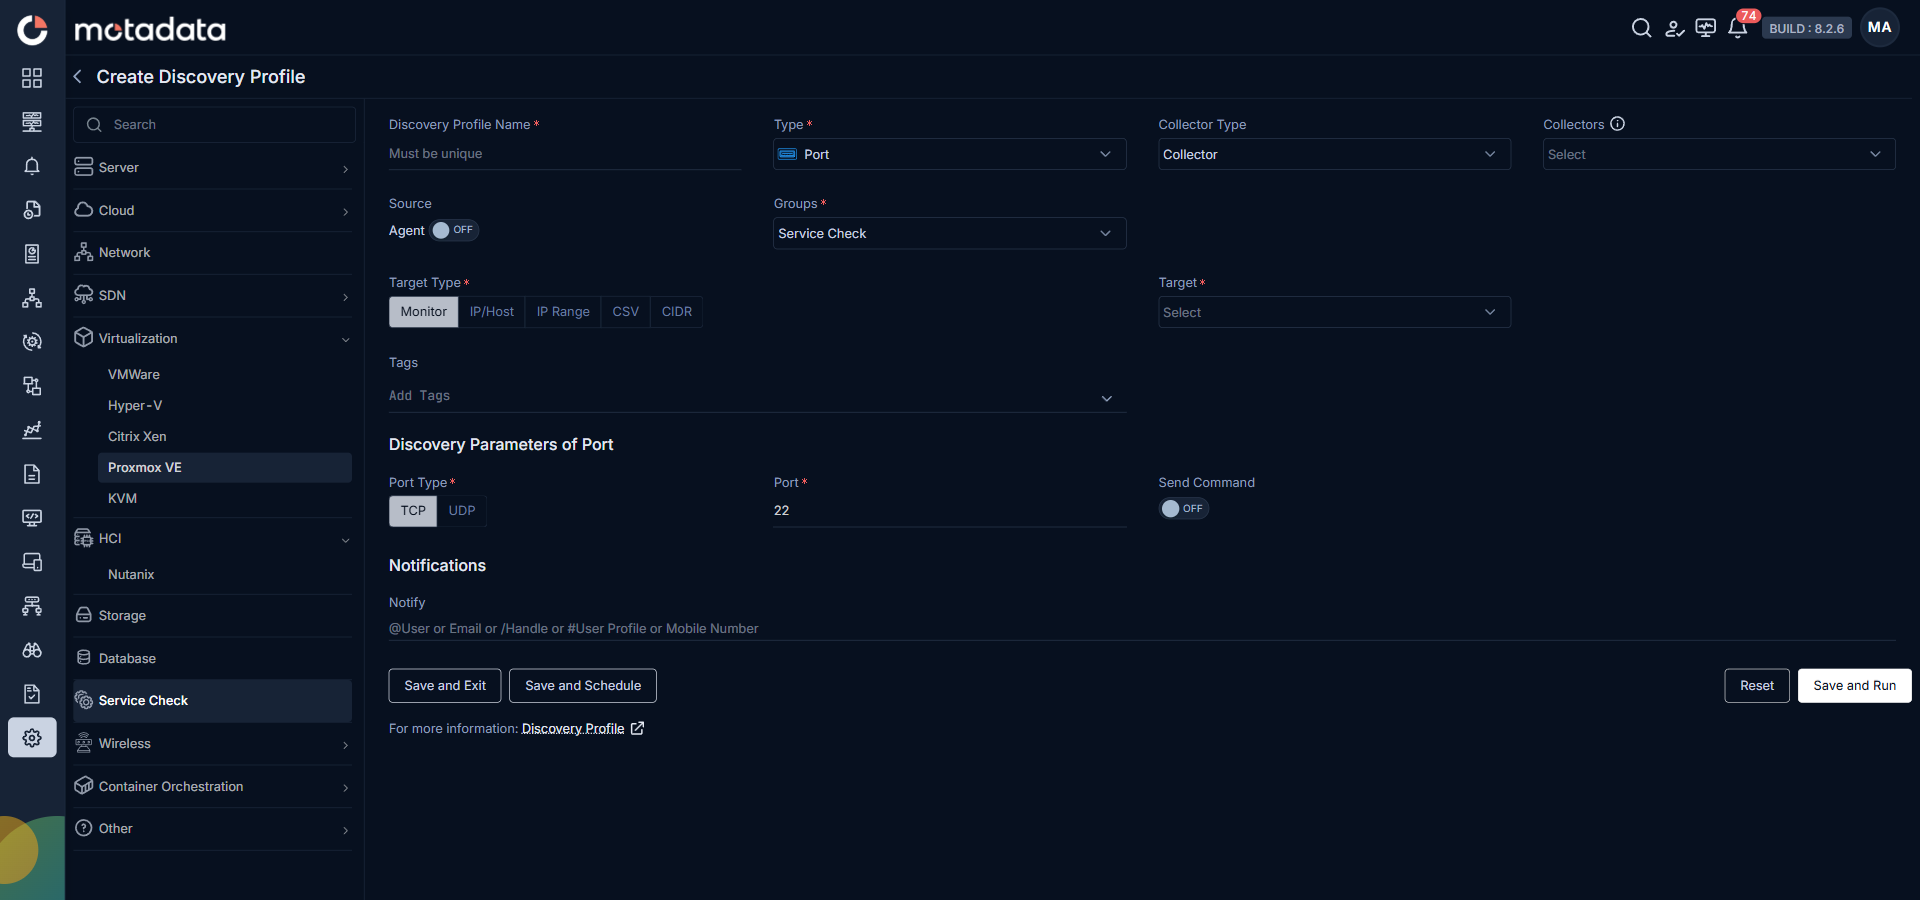
The Create Discovery Profile form opens. Select Service Check from the sidebar.
| Field | What to Enter |
|---|---|
| Discovery Profile Name | A unique name to identify this profile |
| Type | Select Port |
| Collectors | One or more Collectors for data collection. If you skip this, ObserveOps selects a Collector automatically. |
| Agent | Toggle on to route monitoring through a MotaAgent. |
| Agents | The agent to use. Only appears when the Agent toggle is on. |
| Groups | One or more Groups to assign to provisioned monitors |
| Target Type | The address format for the port check target: - Monitor: A monitor already in ObserveOps. - IP: A single IP address. - IP Range: A continuous range of IP addresses. - CIDR: A subnet in CIDR notation. - CSV: A CSV file containing IP addresses. |
| Target | The specific monitor, IP, range, CIDR, or CSV file to check |
| Tags | Tags to assign to discovered monitors |
| Port Type | Select TCP or UDP. - TCP shows a Send Command toggle. - UDP lets you specify Command, Max Command Output Lines, and Search Keyword. |
| Port | The port number to check |
| Send Command | Toggle on to execute a command on the target port. Only appears for TCP. |
| Command | The command to execute on the port. Only appears when Send Command is on. |
| Max Command Output Lines | How many lines of command output to inspect. Setting this to 1 checks only the first line. |
| Search Keyword | The string to look for in the command output |
| Notify Team | Email addresses, handles, or user profiles to notify when discovery completes |
Select Collectors based on how you want to distribute the monitoring load.
Select Save and Run to save and start discovery immediately. Select Save and Schedule to schedule the run for a specific time. Select Save and Exit to save without running.
2. Provision the Discovered Devices as Monitors
After the discovery run completes, ObserveOps shows all discovered devices.

Select the devices you want to add as Monitors. Select Add Selected Objects to provision them. ObserveOps now checks availability continuously.
To view the monitors, go to Menu. Select Monitor. Select Service Check.
Adding URL for Monitoring
1. Create a Credential Profile
Go to Menu. Select Settings . Select Discovery Settings . Select Credential Profile. The Credential Profile screen opens. Select Create Credential Profile.
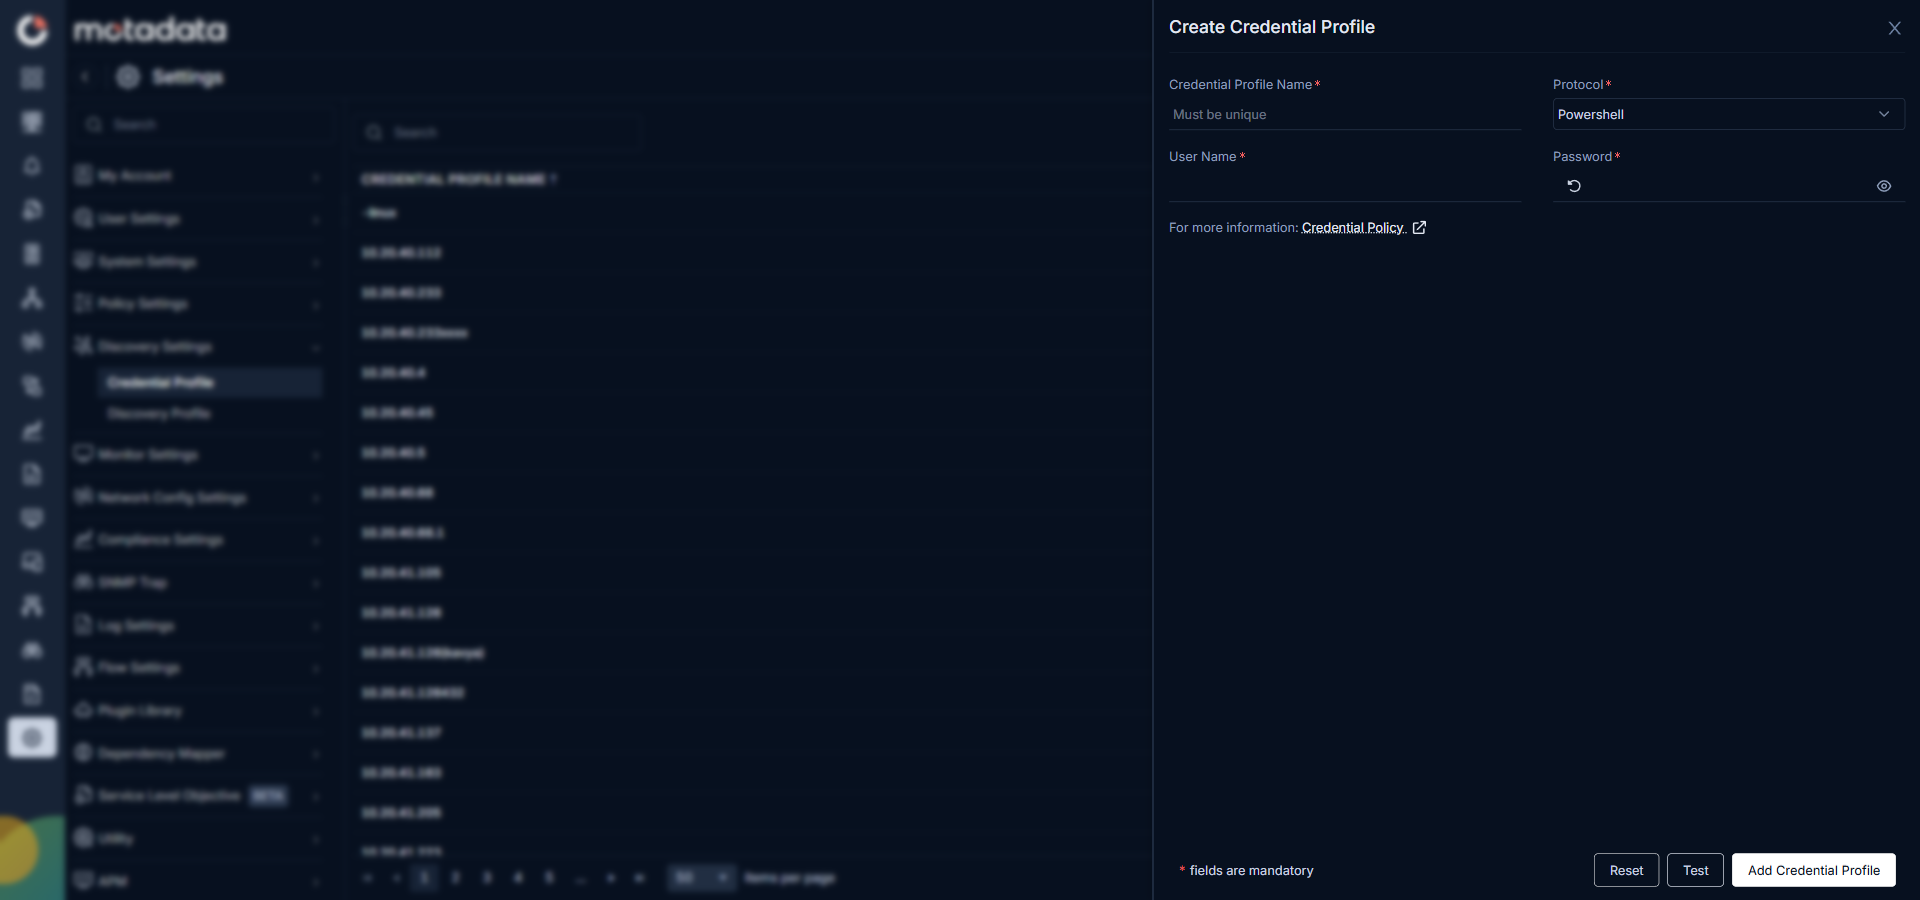
The Create Credential Profile form opens.
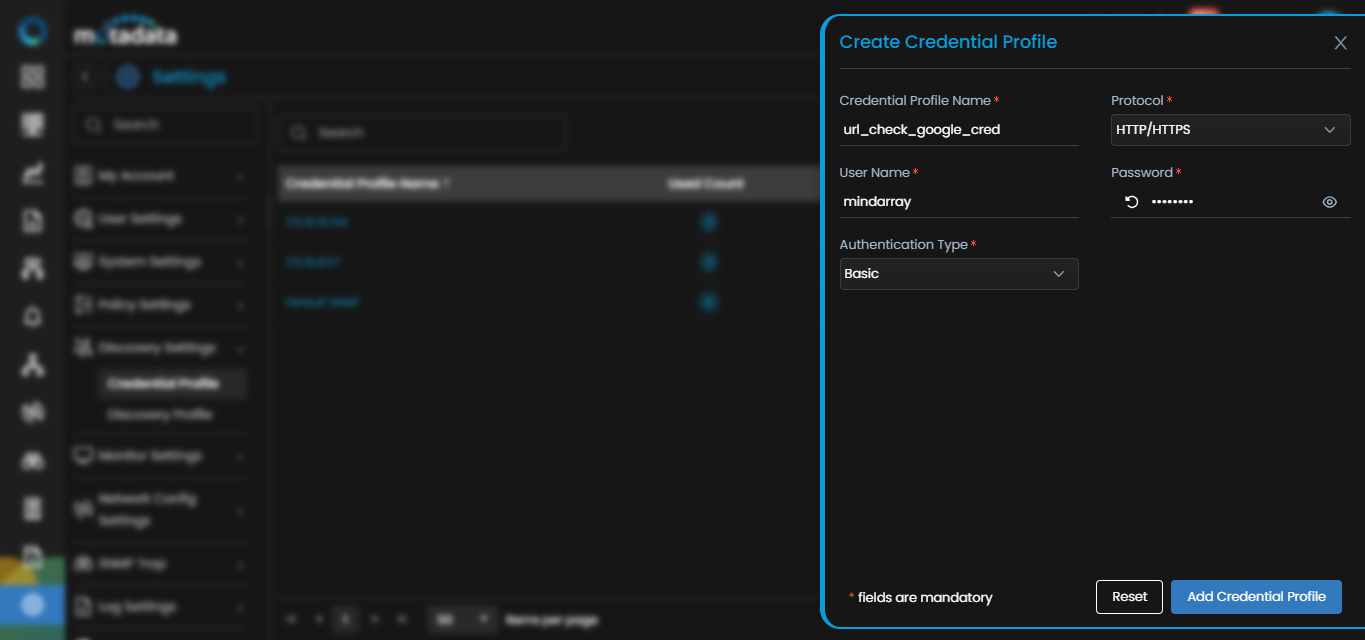
| Field | What to Enter |
|---|---|
| Credential Profile Name | A unique name to identify this profile |
| Protocol | Select HTTP/HTTPS |
| Username | The username for the URL (if authentication is required) |
| Password | The password for that account |
| Authentication Type | The authentication type configured on the URL |
Select Reset to clear all fields. Select Add Credential Profile to save.
2. Create a Discovery Profile
Go to Menu. Select Settings . Select Discovery Settings . Select Discovery Profile. The Discovery Profile screen opens. Select Create Discovery Profile.
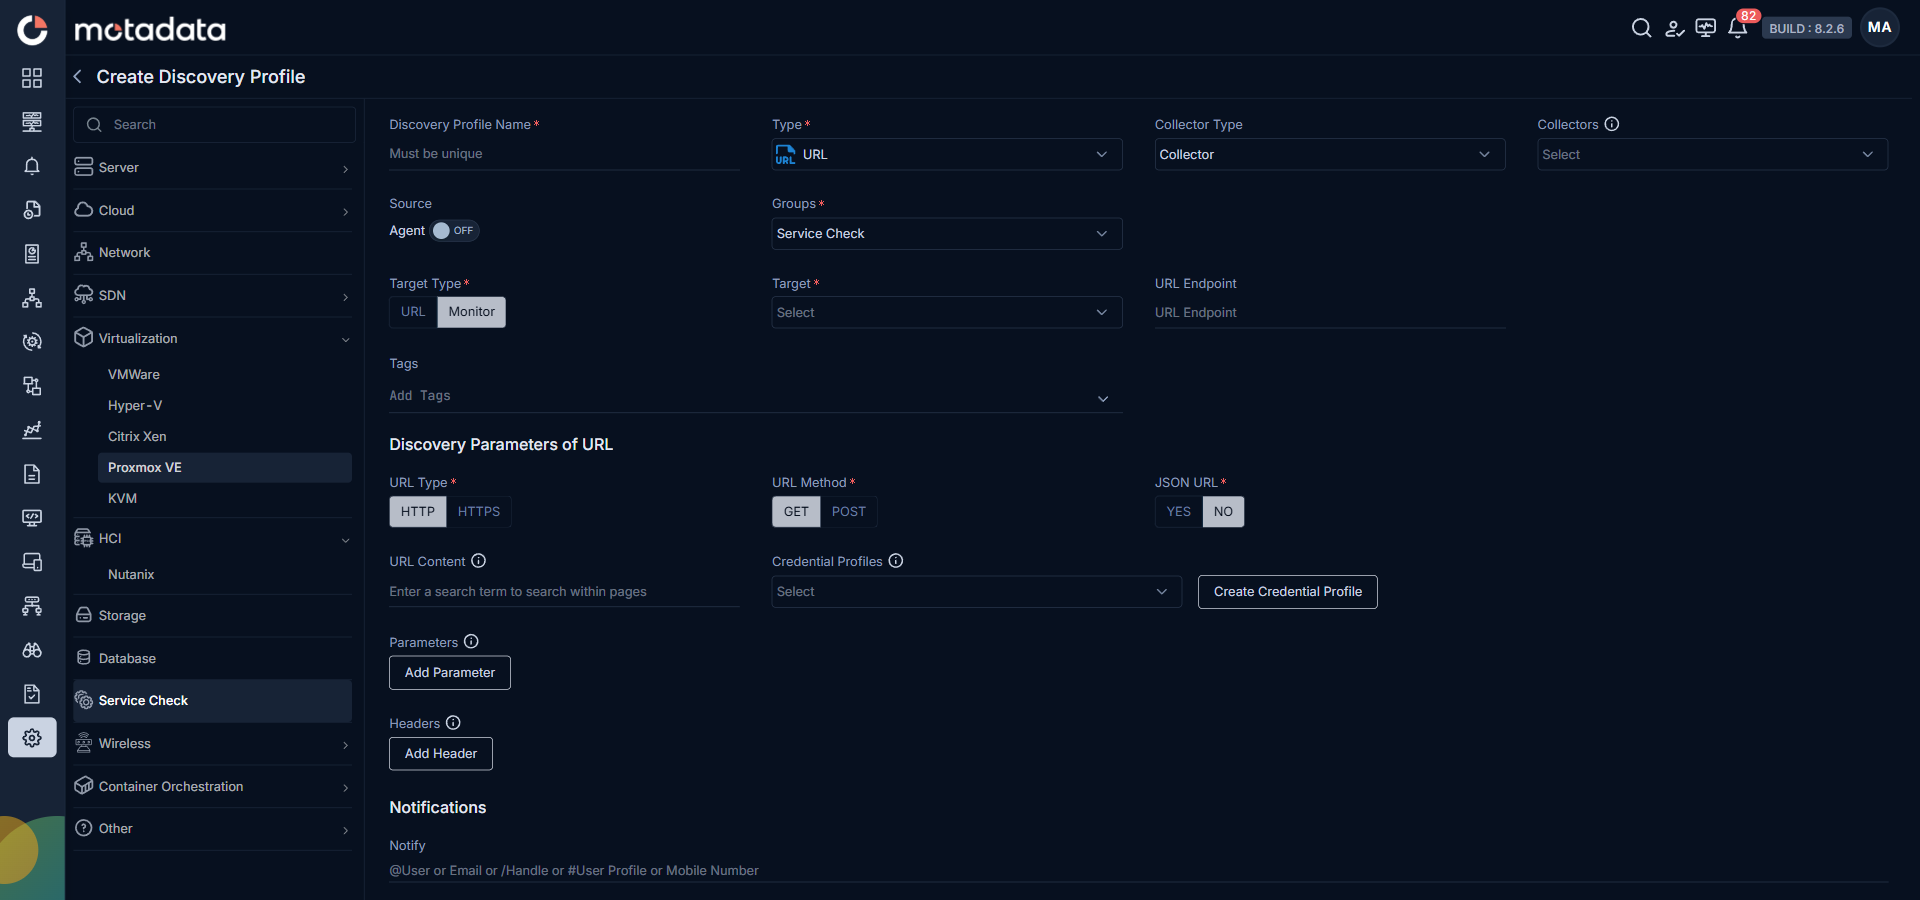
The Create Discovery Profile form opens. Select Service Check from the sidebar.
| Field | What to Enter |
|---|---|
| Discovery Profile Name | A unique name to identify this profile |
| Type | Select URL |
| Collectors | One or more Collectors for data collection. If you skip this, ObserveOps selects a Collector automatically. |
| Agent | Toggle on to route monitoring through a MotaAgent. |
| Agents | The agent to use. Only appears when the Agent toggle is on. |
| Groups | One or more Groups to assign to provisioned monitors |
| Target Type | The target for the URL check: - Monitor: A monitor already in ObserveOps. - URL: The URL to check directly. |
| Target | The specific monitor or URL to check |
| URL Endpoint | The URL endpoint to monitor |
| Tags | Tags to assign to discovered monitors |
| URL Type | Select HTTP or HTTPS |
| URL Method | Select GET or POST |
| JSON URL | Toggle on if the URL returns JSON |
| URL Content | The string to search for in the URL response |
| Credential Profile | Select the URL credential profile you just created |
| Parameters | Query parameters to pass to the API endpoint |
| Headers | HTTP headers to include in the request |
| Notify Team | Email addresses, handles, or user profiles to notify when discovery completes |
Select Collectors based on how you want to distribute the monitoring load.
Select Save and Run to save and start discovery immediately. Select Save and Schedule to schedule the run for a specific time. Select Save and Exit to save without running.
3. Provision the Discovered Devices as Monitors
After the discovery run completes, ObserveOps shows all discovered URLs.

Select the ones you want to add as Monitors. Select Add Selected Objects to provision them. ObserveOps now checks availability continuously.
To view the monitors, go to Menu. Select Monitor. Select Service Check.
Adding RADIUS for Monitoring
1. Create a Discovery Profile
Go to Menu. Select Settings . Select Discovery Settings . Select Discovery Profile. The Discovery Profile screen opens. Select Create Discovery Profile.
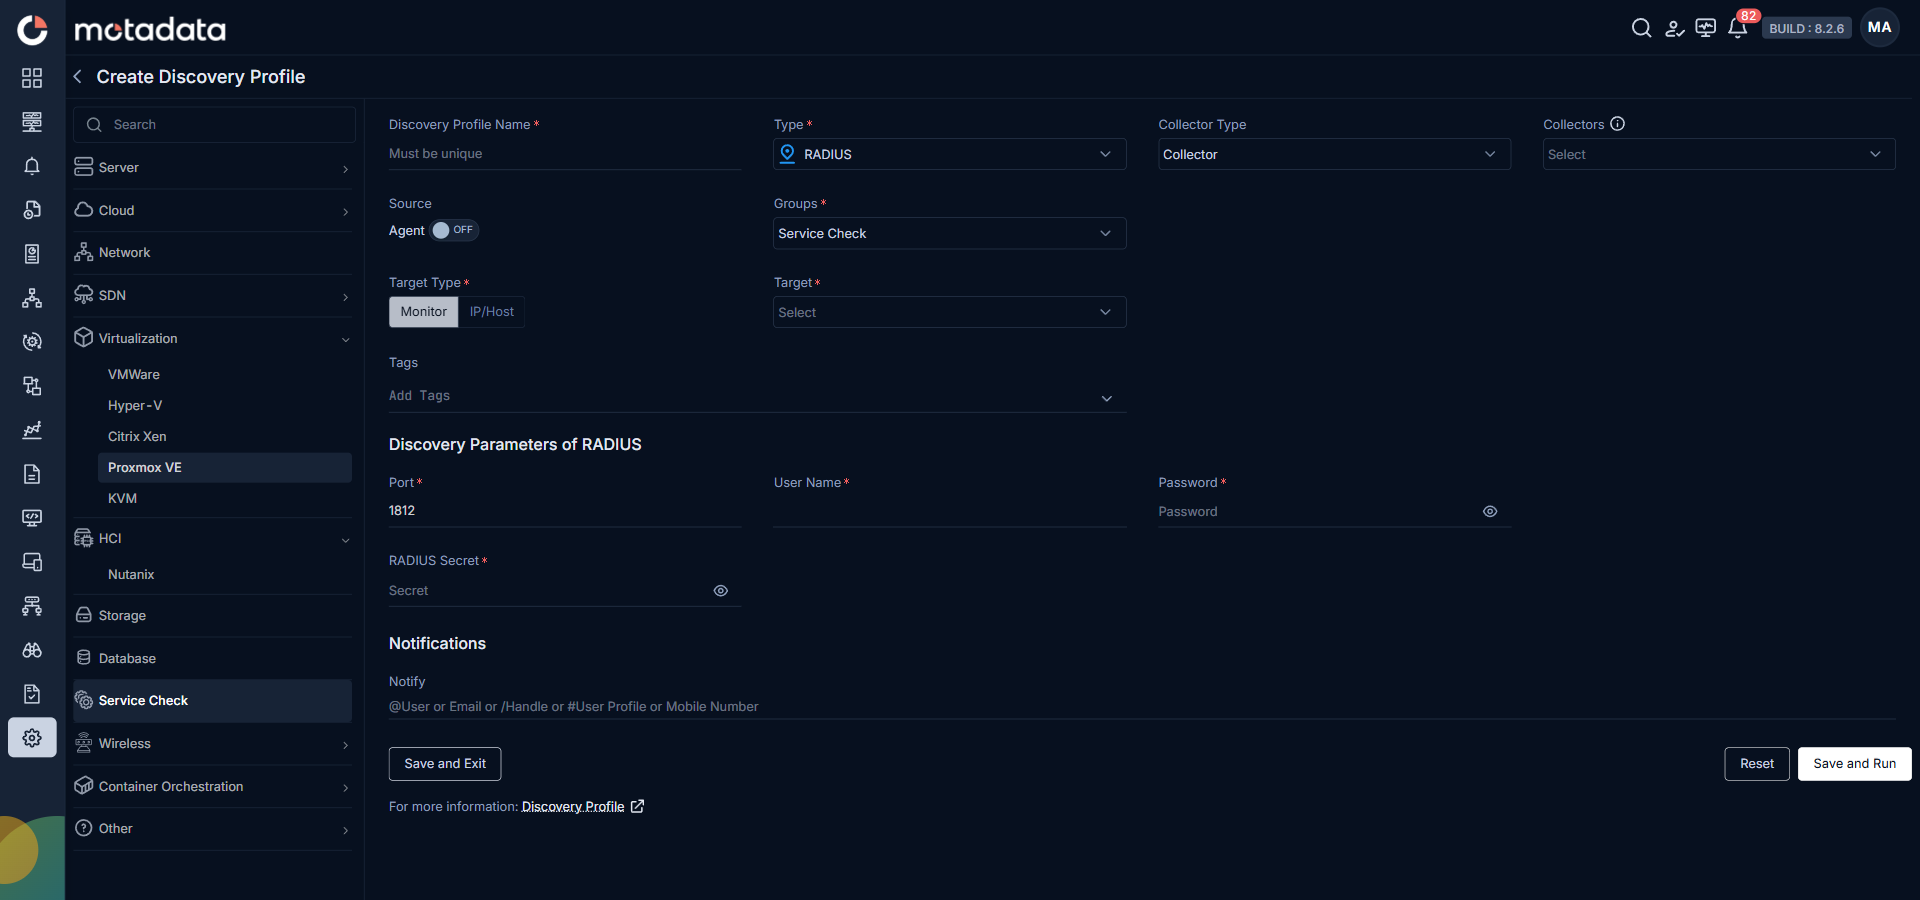
The Create Discovery Profile form opens. Select Service Check from the sidebar.
| Field | What to Enter |
|---|---|
| Discovery Profile Name | A unique name to identify this profile |
| Type | Select RADIUS |
| Collectors | One or more Collectors for data collection. If you skip this, ObserveOps selects a Collector automatically. |
| Agent | Toggle on to route monitoring through a MotaAgent. |
| Agents | The agent to use. Only appears when the Agent toggle is on. |
| Groups | One or more Groups to assign to provisioned monitors |
| Target Type | The target for the RADIUS check: - Monitor: A monitor already in ObserveOps. - IP/Host: The IP address or hostname of the RADIUS server. |
| Target | The specific monitor or IP/host to check |
| Tags | Tags to assign to discovered monitors |
| Port | Pre-populated with the default RADIUS port. Change only if needed. |
| Username | The RADIUS server username |
| Password | The RADIUS server password |
| RADIUS Secret | The shared secret for the RADIUS network |
| Notify Team | Email addresses, handles, or user profiles to notify when discovery completes |
Select Collectors based on how you want to distribute the monitoring load.
Select Save and Run to save and start discovery immediately. Select Save and Schedule to schedule the run for a specific time. Select Save and Exit to save without running.
2. Provision the Discovered Devices as Monitors
After the discovery run completes, ObserveOps shows all discovered RADIUS services. Select the ones you want to add as Monitors. Select Add Selected Objects to provision them. ObserveOps now checks availability continuously.
To view the monitors, go to Menu. Select Monitor. Select Service Check.
Adding REST API for Monitoring
1. Create a Discovery Profile
Go to Menu. Select Settings . Select Discovery Settings . Select Discovery Profile. The Discovery Profile screen opens. Select Create Discovery Profile.
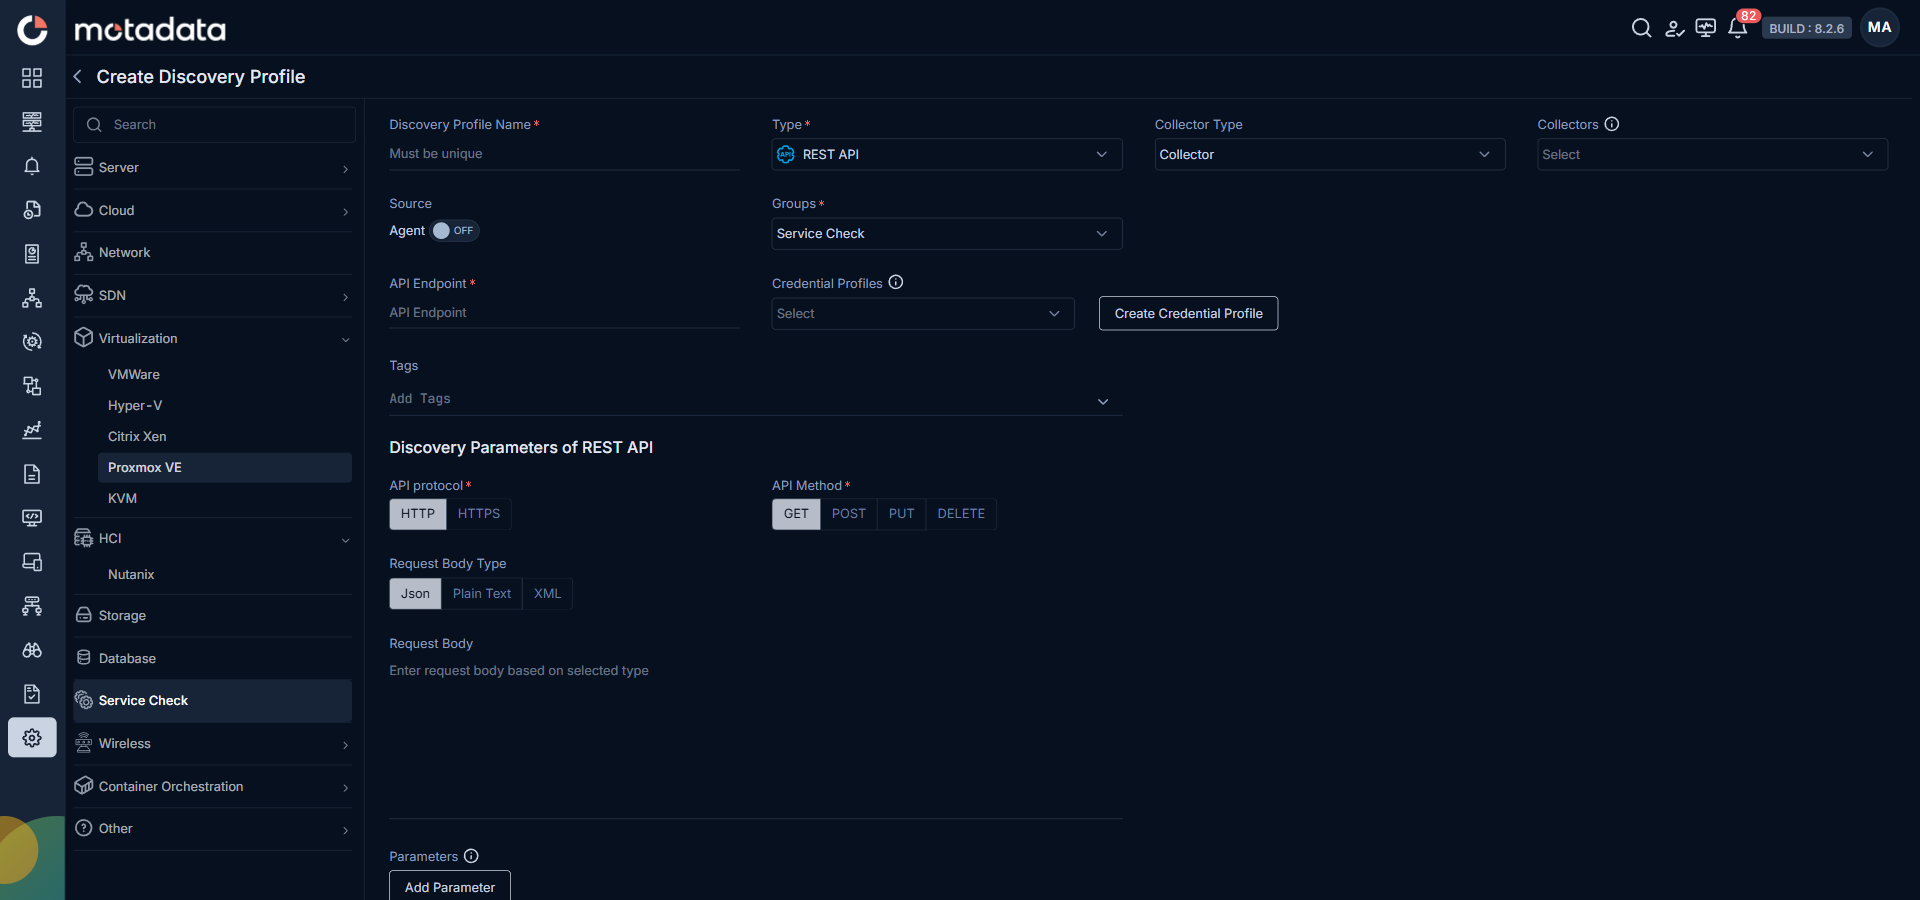
The Create Discovery Profile form opens. Select Service Check from the sidebar.
| Field | What to Enter |
|---|---|
| Discovery Profile Name | A unique name to identify this profile |
| Type | Select REST API |
| Collectors | One or more Collectors for data collection. If you skip this, ObserveOps selects a Collector automatically. |
| Agent | Toggle on to route monitoring through a MotaAgent. |
| Agents | The agent to use. Only appears when the Agent toggle is on. |
| Groups | One or more Groups to assign to provisioned monitors |
| API Endpoint | The API endpoint to monitor |
| Credential Profile | Select the credential profile to use. Select Create Credential Profile to create a new one. |
| Tags | Tags to assign to discovered monitors |
| API Protocol | Select HTTP or HTTPS |
| API Method | Select GET, POST, PUT, or DELETE |
| Request Body Type | Select JSON, Plain Text, or XML |
| Request Body | The request body content, matching the selected type |
| Parameters | Query parameters to pass to the endpoint |
| Headers | HTTP headers to include in the request |
| API Content Check | Toggle on to verify the response content. - Enter Should contain and Should not contain values to validate the response body. |
| Content-Type Value | Select JSON, Plain Text, or XML |
| Notify Team | Email addresses, handles, or user profiles to notify when discovery completes |
Select Collectors based on how you want to distribute the monitoring load.
Select Save and Run to save and start discovery immediately. Select Save and Schedule to schedule the run. Select Save and Exit to save without running.
2. Provision the Discovered Devices as Monitors
After the discovery run completes, ObserveOps shows all discovered REST API endpoints. Select the ones you want to add as Monitors. Select Add Selected Objects to provision them. ObserveOps now checks availability continuously.
To view the monitors, go to Menu. Select Monitor. Select Service Check.
Adding NTP for Monitoring
1. Create a Discovery Profile
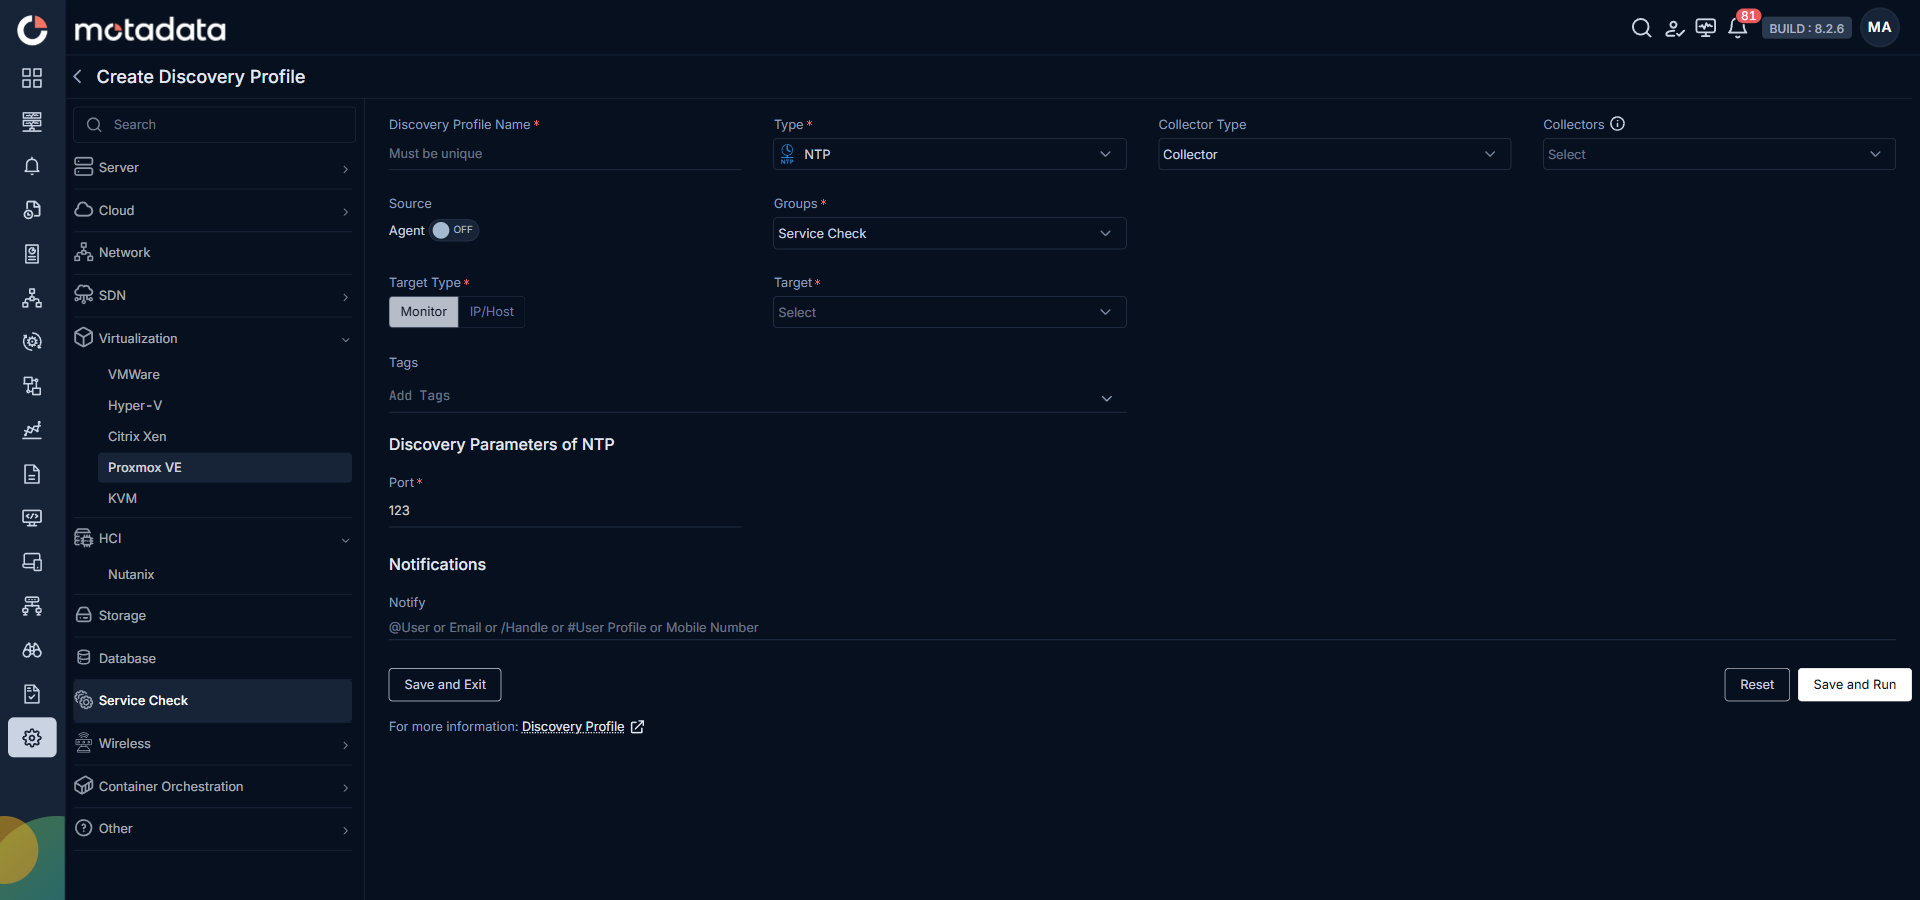
Go to Menu. Select Settings . Select Discovery Settings . Select Discovery Profile. The Discovery Profile screen opens. Select Create Discovery Profile.
The Create Discovery Profile form opens. Select Service Check from the sidebar.
| Field | What to Enter |
|---|---|
| Discovery Profile Name | A unique name to identify this profile |
| Type | Select NTP |
| Collectors | One or more Collectors for data collection. If you skip this, ObserveOps selects a Collector automatically. |
| Agent | Toggle on to route monitoring through a MotaAgent. |
| Agents | The agent to use. Only appears when the Agent toggle is on. |
| Groups | One or more Groups to assign to provisioned monitors |
| Target Type | The target for the NTP check: - Monitor: A monitor already in ObserveOps. - IP/Host: The IP address or hostname of the NTP server. |
| Target | The specific monitor or IP/host to check |
| Tags | Tags to assign to discovered monitors |
| Port | Pre-populated with the default NTP port. Change only if needed. |
| Notify Team | Email addresses, handles, or user profiles to notify when discovery completes |
Select Collectors based on how you want to distribute the monitoring load.
Select Save and Run to save and start discovery immediately. Select Save and Schedule to schedule the run for a specific time. Select Save and Exit to save without running.
2. Provision the Discovered Devices as Monitors
After the discovery run completes, ObserveOps shows all discovered NTP services. Select the ones you want to add as Monitors. Select Add Selected Objects to provision them. ObserveOps now checks availability continuously.
To view the monitors, go to Menu. Select Monitor. Select Service Check.
Adding Domain for Monitoring
1. Create a Discovery Profile
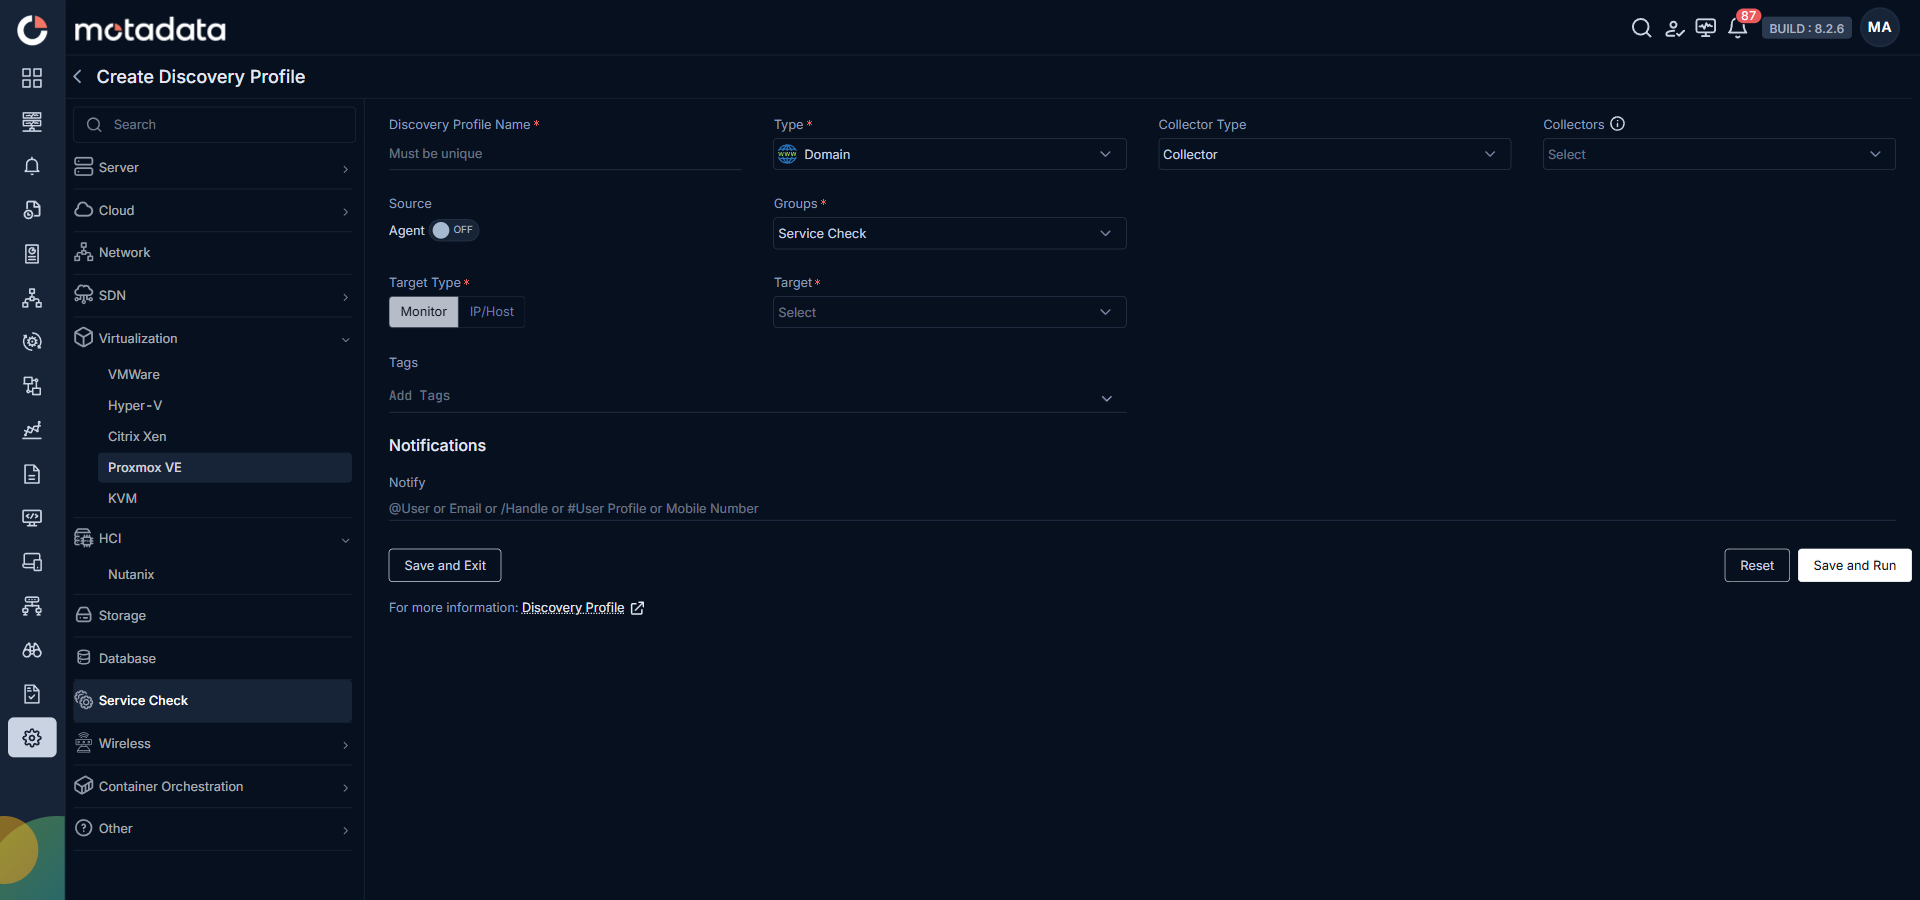
Go to Menu. Select Settings . Select Discovery Settings . Select Discovery Profile. The Discovery Profile screen opens. Select Create Discovery Profile.
The Create Discovery Profile form opens. Select Service Check from the sidebar.
| Field | What to Enter |
|---|---|
| Discovery Profile Name | A unique name to identify this profile |
| Type | Select Domain |
| Collectors | One or more Collectors for data collection. If you skip this, ObserveOps selects a Collector automatically. |
| Agent | Toggle on to route monitoring through a MotaAgent. |
| Agents | The agent to use. Only appears when the Agent toggle is on. |
| Groups | One or more Groups to assign to provisioned monitors |
| Target Type | The target for the Domain check: - Monitor: A monitor already in ObserveOps. - IP/Host: The IP address or hostname to check. |
| Target | The specific monitor or IP/host to check |
| Tags | Tags to assign to discovered monitors |
| Notify Team | Email addresses, handles, or user profiles to notify when discovery completes |
Select Collectors based on how you want to distribute the monitoring load.
Select Save and Run to save and start discovery immediately. Select Save and Schedule to schedule the run for a specific time. Select Save and Exit to save without running.
2. Provision the Discovered Devices as Monitors
After the discovery run completes, ObserveOps shows all discovered domains. Select the ones you want to add as Monitors. Select Add Selected Objects to provision them. ObserveOps now checks availability continuously.
To view the monitors, go to Menu. Select Monitor. Select Service Check.
Adding DNS for Monitoring
1. Create a Discovery Profile
Go to Menu. Select Settings . Select Discovery Settings . Select Discovery Profile. The Discovery Profile screen opens. Select Create Discovery Profile.
The Create Discovery Profile form opens. Select Service Check from the sidebar.
| Field | What to Enter |
|---|---|
| Discovery Profile Name | A unique name to identify this profile |
| Type | Select DNS |
| Collectors | One or more Collectors for data collection. If you skip this, ObserveOps selects a Collector automatically. |
| Agent | Toggle on to route monitoring through a MotaAgent. |
| Agents | The agent to use. Only appears when the Agent toggle is on. |
| Groups | One or more Groups to assign to provisioned monitors |
| Target Type | The target for the DNS check: - Monitor: A monitor already in ObserveOps. - IP/Host: The IP address or hostname of the DNS server. |
| Target | The specific monitor or IP/host to check |
| Tags | Tags to assign to discovered monitors |
| Port | Pre-populated with the default DNS port. Change only if needed. |
| Lookup Address | The DNS lookup address to query |
| DNS Type | The DNS record type to monitor |
| Notify Team | Email addresses, handles, or user profiles to notify when discovery completes |
Select Collectors based on how you want to distribute the monitoring load.
Select Save and Run to save and start discovery immediately. Select Save and Schedule to schedule the run for a specific time. Select Save and Exit to save without running.
2. Provision the Discovered Devices as Monitors
After the discovery run completes, ObserveOps shows all discovered DNS services. Select the ones you want to add as Monitors. Select Add Selected Objects to provision them. ObserveOps now checks availability continuously.
To view the monitors, go to Menu. Select Monitor. Select Service Check.
Adding FTP for Monitoring
1. Create a Discovery Profile
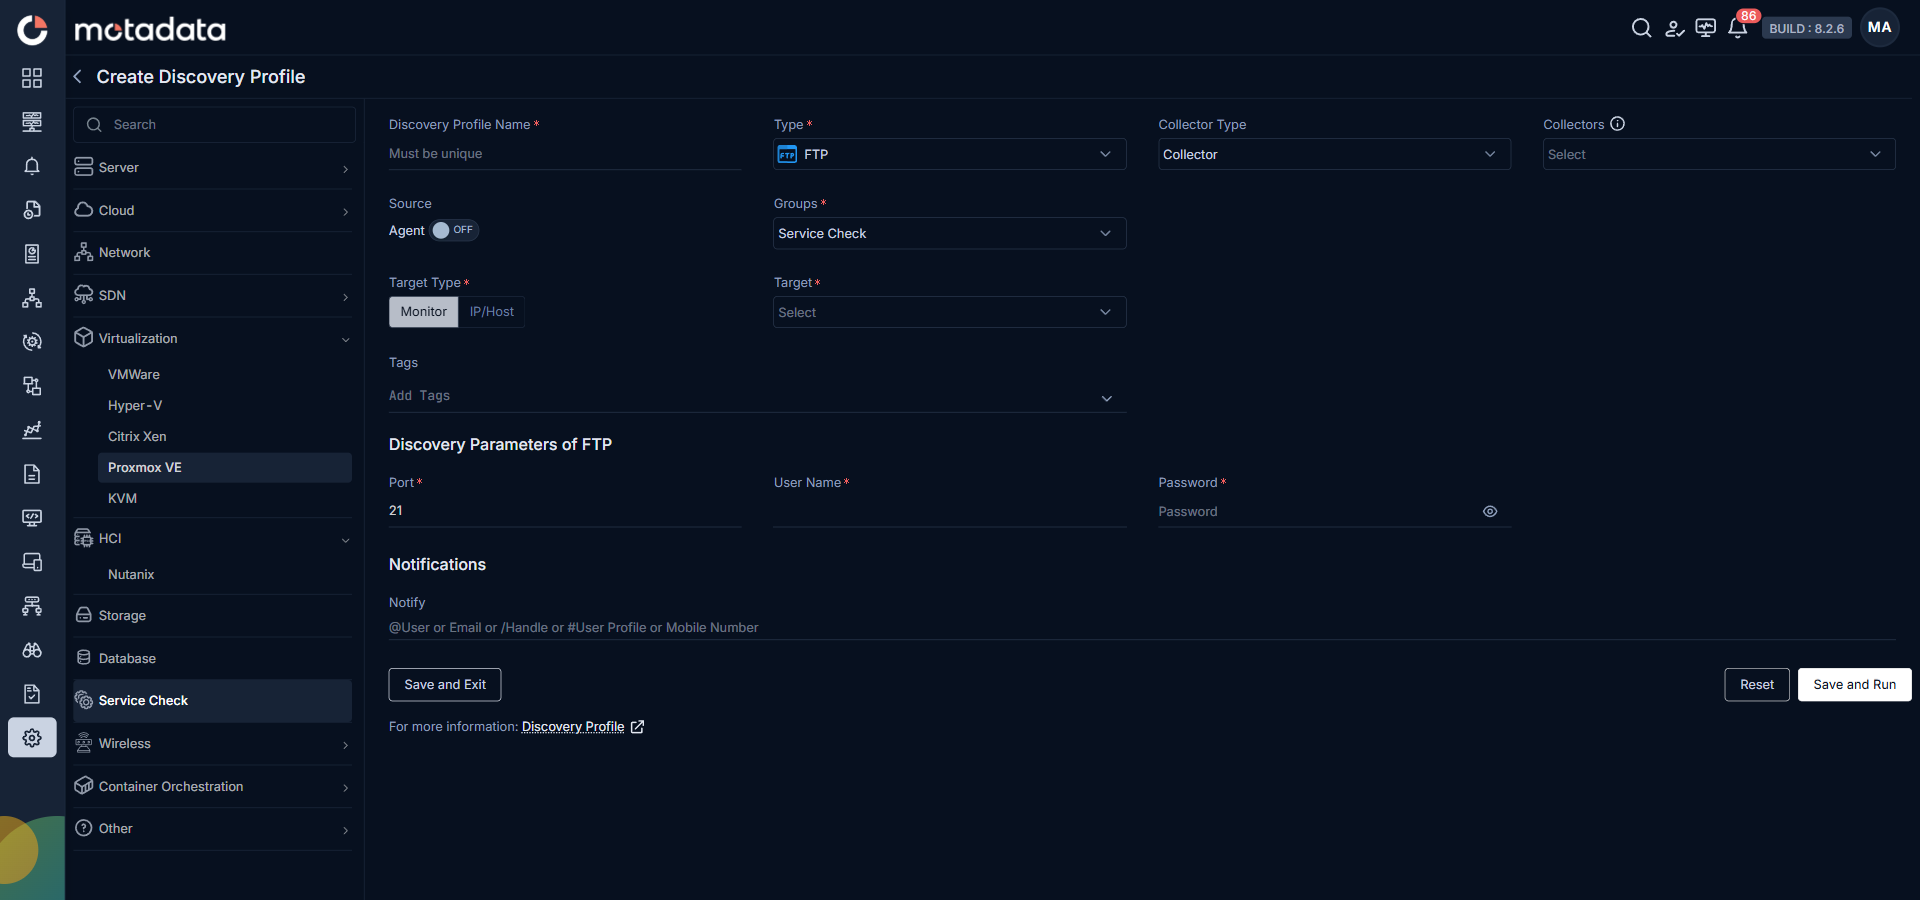
Go to Menu. Select Settings . Select Discovery Settings . Select Discovery Profile. The Discovery Profile screen opens. Select Create Discovery Profile.
The Create Discovery Profile form opens. Select Service Check from the sidebar.
| Field | What to Enter |
|---|---|
| Discovery Profile Name | A unique name to identify this profile |
| Type | Select FTP |
| Collectors | One or more Collectors for data collection. If you skip this, ObserveOps selects a Collector automatically. |
| Agent | Toggle on to route monitoring through a MotaAgent. |
| Agents | The agent to use. Only appears when the Agent toggle is on. |
| Groups | One or more Groups to assign to provisioned monitors |
| Target Type | The target for the FTP check: - Monitor: A monitor already in ObserveOps. - URL: The IP address or hostname of the FTP server. |
| Target | The specific monitor or IP/host to check |
| Tags | Tags to assign to discovered monitors |
| Port | Pre-populated with the default FTP port. Change only if needed. |
| Username | The FTP server username |
| Password | The FTP server password |
| Notify Team | Email addresses, handles, or user profiles to notify when discovery completes |
Select Collectors based on how you want to distribute the monitoring load.
Select Save and Run to save and start discovery immediately. Select Save and Schedule to schedule the run for a specific time. Select Save and Exit to save without running.
2. Provision the Discovered Devices as Monitors
After the discovery run completes, ObserveOps shows all discovered FTP services.

Select the ones you want to add as Monitors. Select Add Selected Objects to provision them. ObserveOps now checks availability continuously.
To view the monitors, go to Menu. Select Monitor. Select Service Check.
Adding Email for Monitoring
1. Create a Discovery Profile
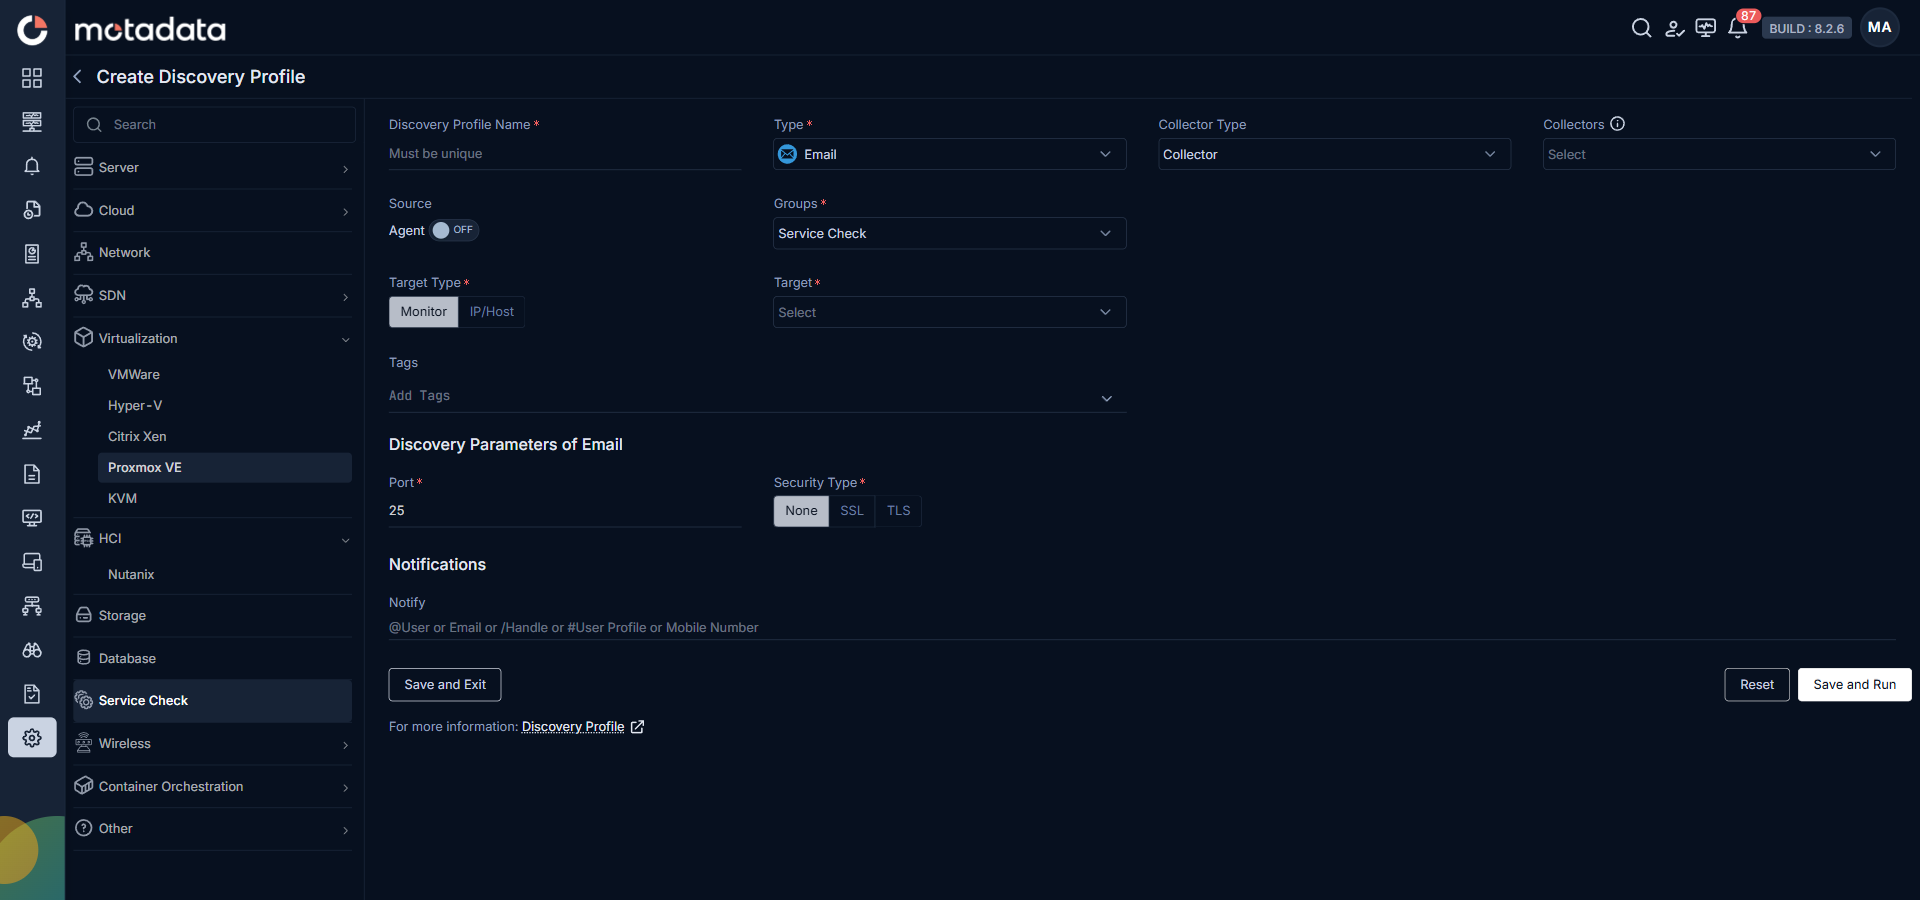
Go to Menu. Select Settings . Select Discovery Settings . Select Discovery Profile. The Discovery Profile screen opens. Select Create Discovery Profile.
The Create Discovery Profile form opens. Select Service Check from the sidebar.
| Field | What to Enter |
|---|---|
| Discovery Profile Name | A unique name to identify this profile |
| Type | Select Email |
| Collectors | One or more Collectors for data collection. If you skip this, ObserveOps selects a Collector automatically. |
| Agent | Toggle on to route monitoring through a MotaAgent. |
| Agents | The agent to use. Only appears when the Agent toggle is on. |
| Groups | One or more Groups to assign to provisioned monitors |
| Target Type | The target for the Email check: - Monitor: A monitor already in ObserveOps. - IP/Host: The IP address or hostname of the email server. |
| Target | The specific monitor or IP/host to check |
| Tags | Tags to assign to discovered monitors |
| Port | Pre-populated with the default email port. Change only if needed. |
| Security Type | The security type configured on the email server |
| Notify Team | Email addresses, handles, or user profiles to notify when discovery completes |
Select Collectors based on how you want to distribute the monitoring load.
Select Save and Run to save and start discovery immediately. Select Save and Schedule to schedule the run for a specific time. Select Save and Exit to save without running.
2. Provision the Discovered Devices as Monitors
After the discovery run completes, ObserveOps shows all discovered email services. Select the ones you want to add as Monitors. Select Add Selected Objects to provision them. ObserveOps now checks availability continuously.
To view the monitors, go to Menu. Select Monitor. Select Service Check.
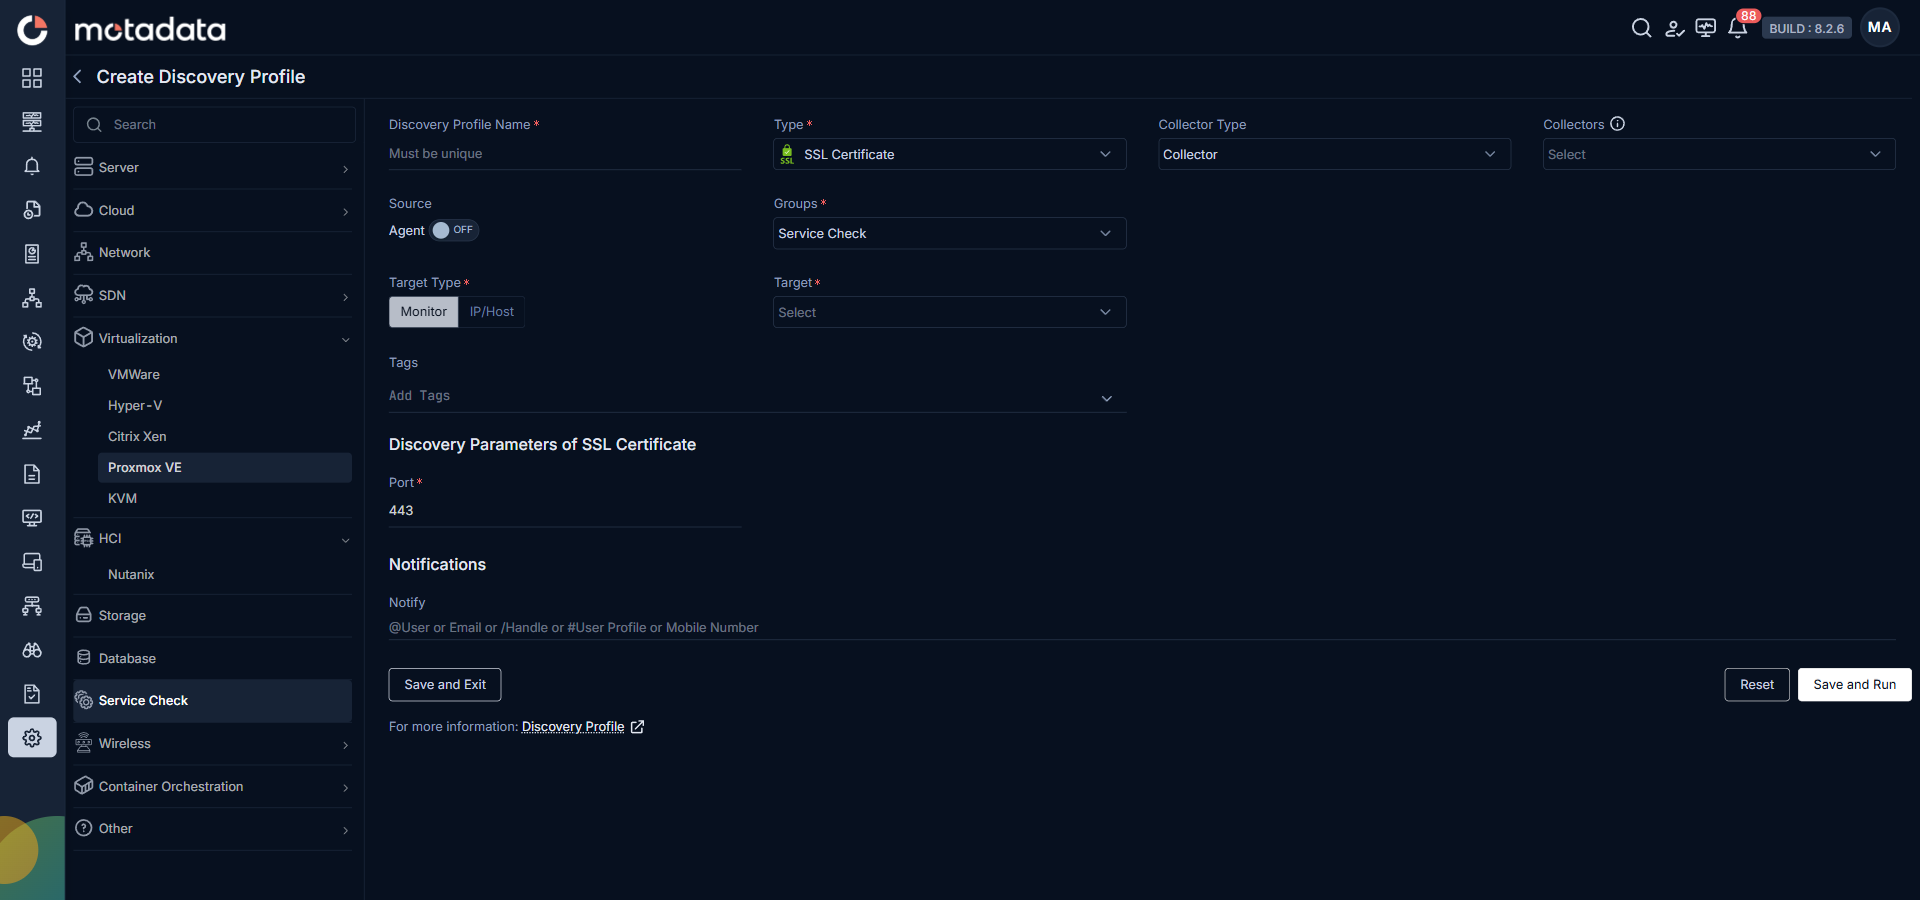
Adding SSL Certificate for Monitoring
1. Create a Discovery Profile
Go to Menu. Select Settings . Select Discovery Settings . Select Discovery Profile. The Discovery Profile screen opens. Select Create Discovery Profile.
The Create Discovery Profile form opens. Select Service Check from the sidebar.
| Field | What to Enter |
|---|---|
| Discovery Profile Name | A unique name to identify this profile |
| Type | Select SSL |
| Collectors | One or more Collectors for data collection. If you skip this, ObserveOps selects a Collector automatically. |
| Agent | Toggle on to route monitoring through a MotaAgent. |
| Agents | The agent to use. Only appears when the Agent toggle is on. |
| Groups | One or more Groups to assign to provisioned monitors |
| Target Type | The target for the SSL certificate check: - Monitor: A monitor already in ObserveOps. - IP/Host: The IP address or hostname to check. |
| Target | The specific monitor or IP/host to check |
| Tags | Tags to assign to discovered monitors |
| Port | Pre-populated with the default HTTPS port. Change only if needed. |
| Notify Team | Email addresses, handles, or user profiles to notify when discovery completes |
Select Collectors based on how you want to distribute the monitoring load.
Select Save and Run to save and start discovery immediately. Select Save and Schedule to schedule the run for a specific time. Select Save and Exit to save without running.
2. Provision the Discovered Devices as Monitors
After the discovery run completes, ObserveOps shows all discovered SSL certificates. Select the ones you want to add as Monitors. Select Add Selected Objects to provision them. ObserveOps now monitors certificate expiry and availability continuously.
To view the monitors, go to Menu. Select Monitor. Select Service Check.